
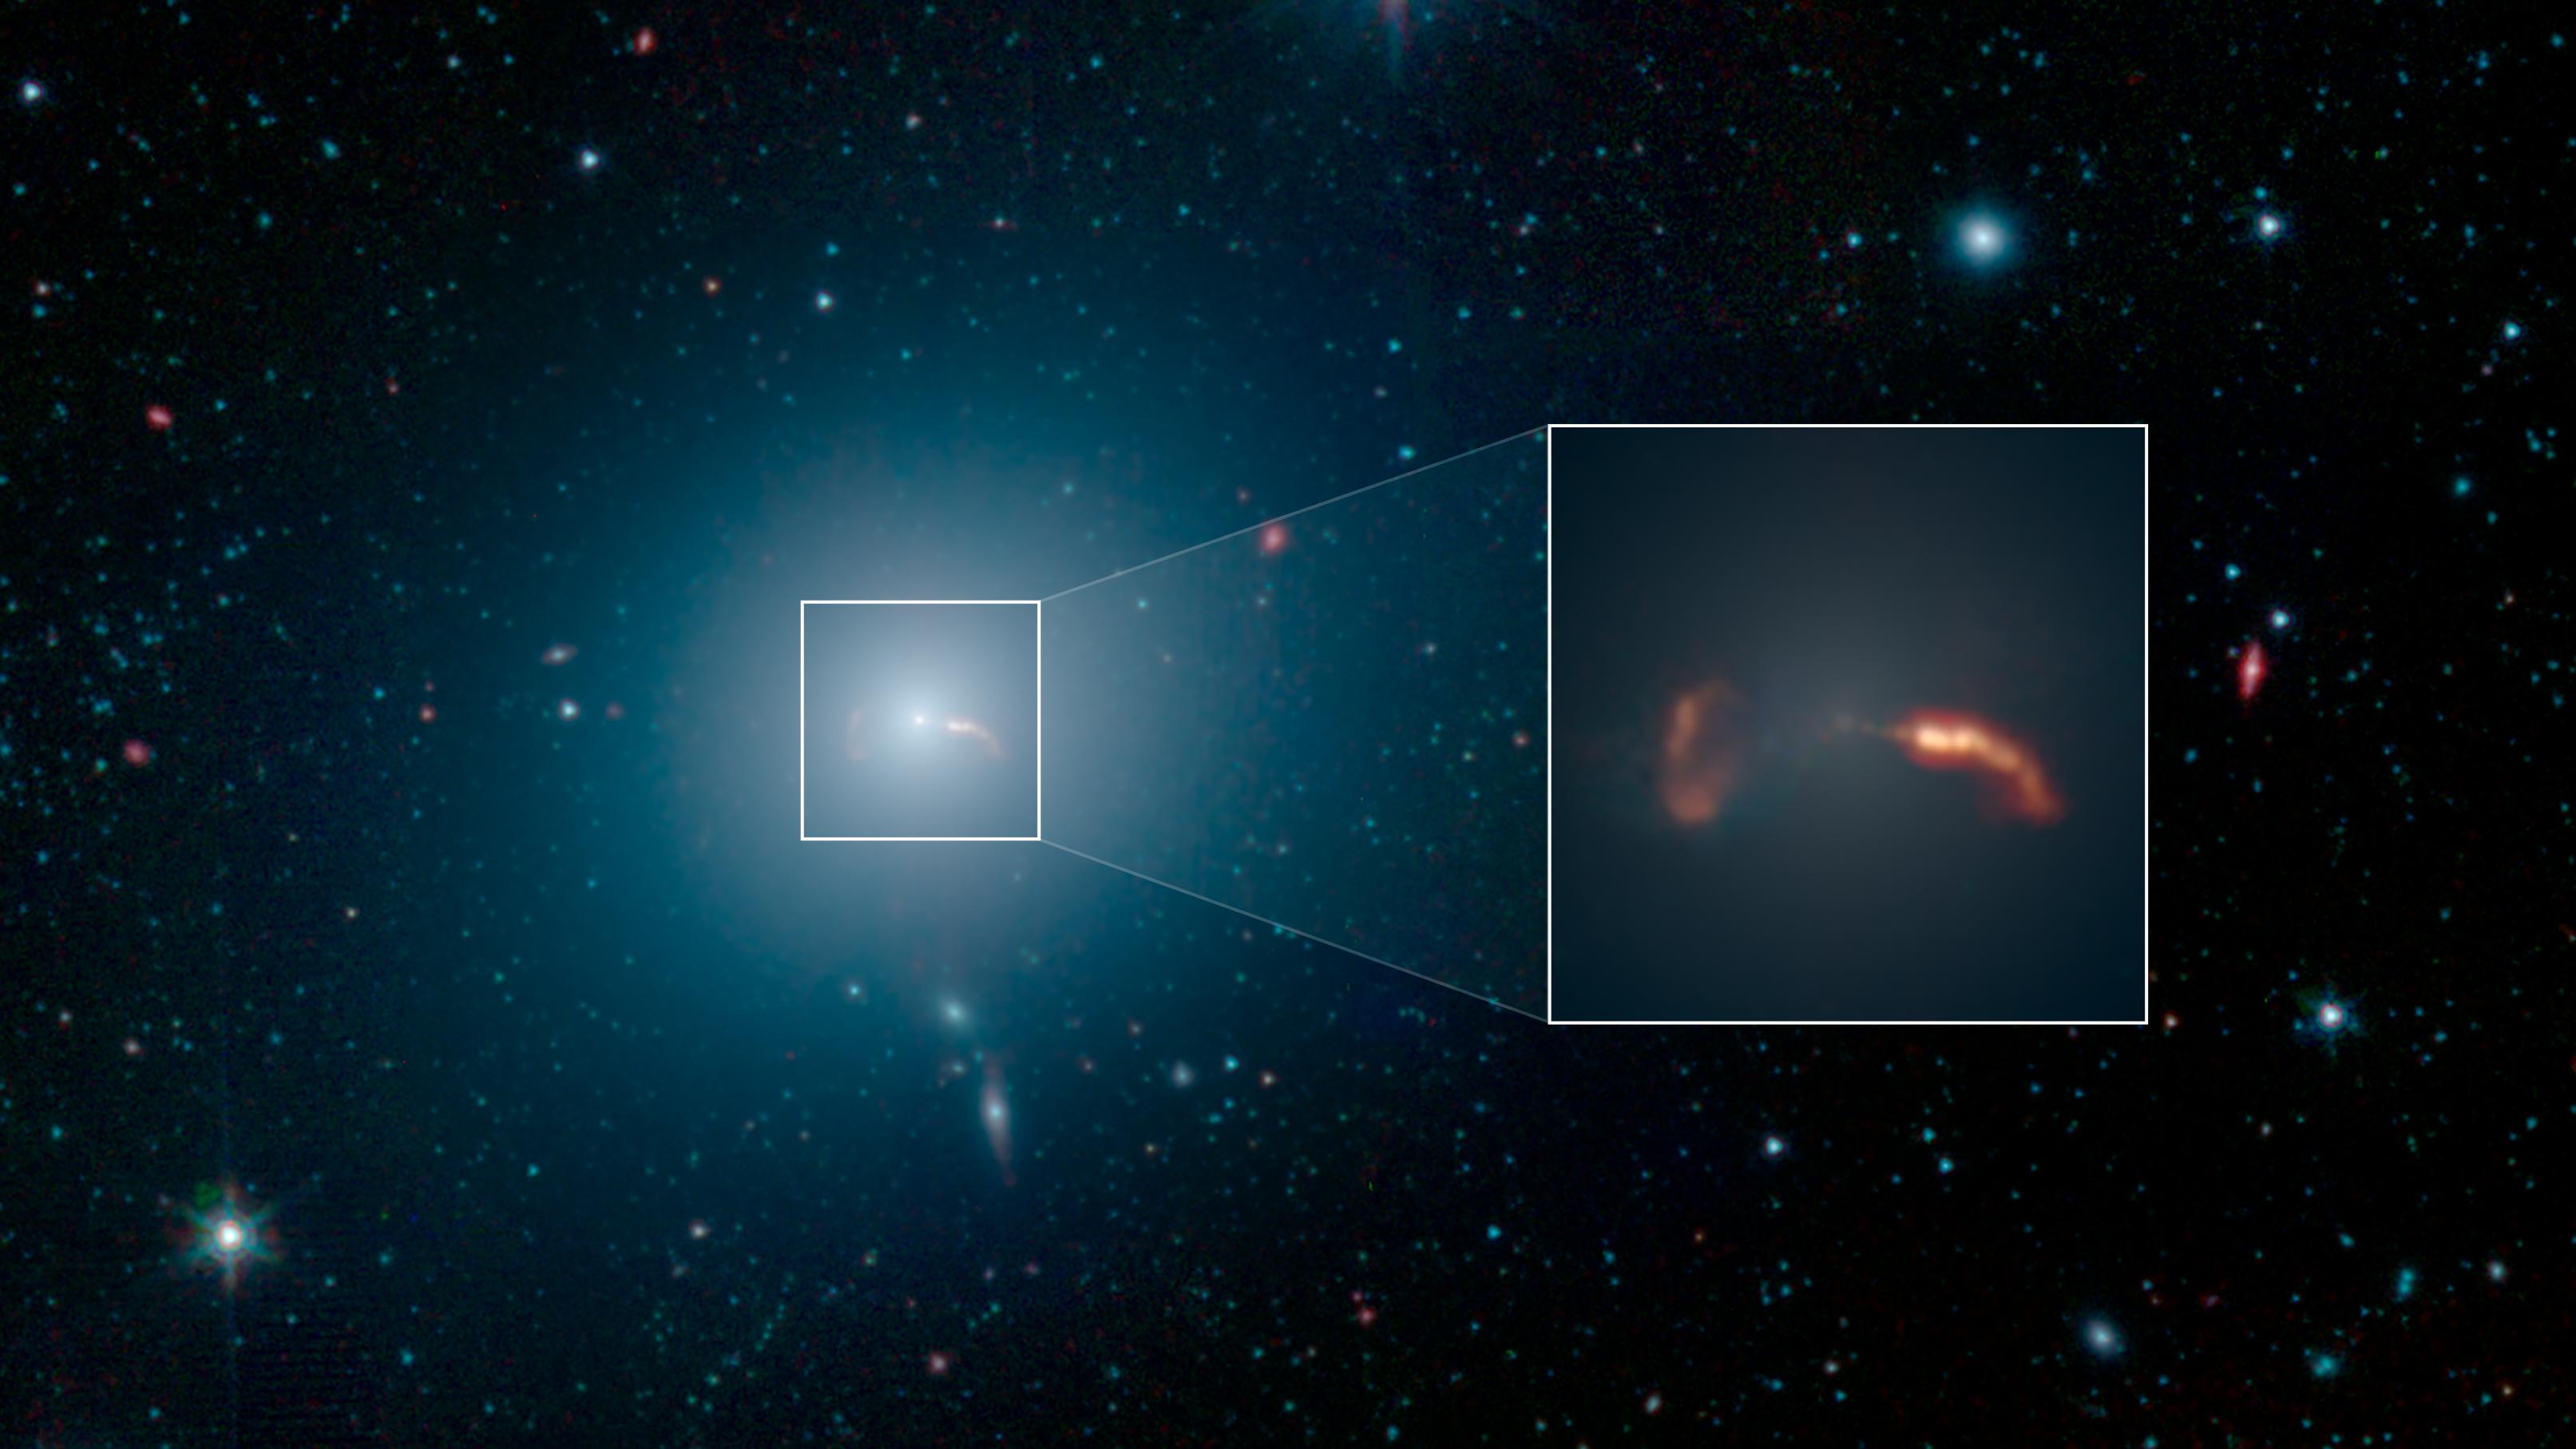
The 2019 image of M87* was, famously, a picture of an absence: a bright, lopsided ring of light wrapped around a dark central patch, the first direct look at the shadow cast by a supermassive black hole. It was a triumph of interferometry, but it was also a single snapshot at a single frequency. A ring is a shape. It doesn't, on its own, tell you what the glowing stuff is, where it sits, or how the light manages to escape a region where gravity is doing its best to keep everything in.
A new study led by Dr. Shan-Shan Zhao at the Shanghai Astronomical Observatory (SHAO), part of the Chinese Academy of Sciences, sets out to answer some of those questions. Published in The Astrophysical Journal Letters, it presents what the team describes as the first spatially resolved, dual-frequency spectral study of M87* — combining data from the Event Horizon Telescope (EHT) with the Global Millimeter VLBI Array (GMVA) to measure not just how bright the region around the black hole is, but how that brightness changes with observing frequency at each point in the image.
Two frequencies are better than one
Why does a second frequency matter so much? Because the spectrum of the emission — how its brightness varies with wavelength — is a fingerprint of the physical conditions producing it. The plasma swirling around M87* radiates via synchrotron emission, the light electrons give off as they spiral along magnetic field lines at close to the speed of light. That emission carries information about the density of the plasma, the strength of the magnetic field, and, crucially, whether the region is transparent to its own light.
By imaging M87* at two frequencies at once and comparing them point by point, the SHAO-led team could build a resolved spectral map rather than a single global average. That is the difference between knowing a city's average temperature and having a thermometer on every street corner. The spectral behavior turns out not to be uniform across the shadow — and the way it changes tells a coherent physical story.
The ~30-microarcsecond dividing line
The headline result is a transition. Working outward from the black hole, the researchers identify a change in the emission's character at roughly 30 microarcseconds. Inside that boundary, the plasma shows the signature of synchrotron self-absorption: the region is so dense with radiating electrons that it reabsorbs a portion of its own synchrotron light before that light can leave. It is, in effect, opaque to itself at these frequencies.
Move beyond the ~30-microarcsecond mark and the picture flips. The outer regions are optically thin — transparent — so photons produced there stream outward and reach our telescopes without being reabsorbed. This is the light that escapes freely, the light that ultimately draws the luminous ring we saw in 2019.
To put the scale in human terms: a microarcsecond is an almost comically small angle. And yet the combined EHT–GMVA array can resolve structure across that ~30-microarcsecond boundary in a galaxy some 53.5 million light-years away. That the transition is spatially resolved — that the team can point to where the plasma goes from opaque to transparent — is what makes the result more than a refinement of a number.
Connecting the 2019 ring to real physics
The 2019 EHT image established that M87* looked the way general relativity predicted a black hole should look. But interpreting exactly what parts of the plasma we were seeing, and how they related to the event horizon, involved a fair amount of modeling. The new work grounds that interpretation in a direct measurement. By mapping where the emission is self-absorbed and where it is optically thin, it ties the ring-like structure imaged in 2019 to the physical state of the plasma near the event horizon.
In other words, the ring is not an abstract shape anymore. It is the visible boundary of a region whose inner plasma is dense and self-shrouding and whose outer plasma is diffuse enough to let light out. The transition at ~30 microarcseconds is the seam between those two regimes, and it now has an observational basis rather than a purely theoretical one.
Why It Matters
Supermassive black holes are, at the level of the singularity, invisible — the whole point of an event horizon is that nothing escapes it. Everything we learn about them, we learn from the plasma just outside, and from the light that plasma emits. Turning that light into physics — magnetic field strength, plasma density, opacity — is the entire game. A resolved, dual-frequency spectral map is a substantial upgrade in that effort, because it lets astronomers read those properties as a function of position rather than as a blurred average over the whole source.
That matters beyond M87* itself. The processes at work here — synchrotron self-absorption, the launching of relativistic jets, the balance between infalling and outflowing plasma — are the same ones thought to govern how supermassive black holes shape their host galaxies over cosmic time. A method that pins down where emission goes from optically thick to thin is a template that can be applied to other targets as very-long-baseline interferometry keeps improving. It also gives theorists a sharper observational constraint to test their simulations against: any model of M87*'s accretion flow now has to reproduce a self-absorption transition at about the right place.
The result is also a marker of how the field is maturing. The first image proved the technique. Studies like this one, drawing on international collaboration across the EHT and GMVA — with contributors including the Max Planck Institute for Radio Astronomy (MPIfR), the INAF Institute of Radio Astronomy, the Andalusian Institute of Astrophysics, and the University of Tsukuba — begin to turn a single striking photograph into a working measurement instrument for the physics of the most extreme environments in the universe.