
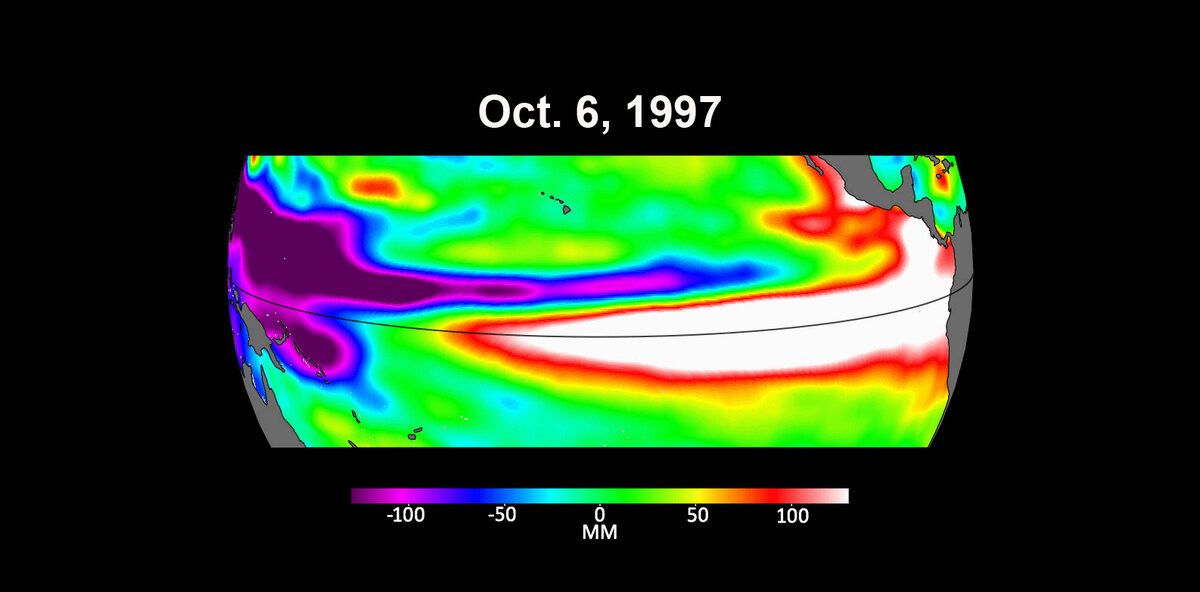
Satellite records sometimes show history being made, and this autumn the evidence is in the height of the ocean. In an Oct. 15 feature, NASA described how its satellite data have followed the 2026 El Niño from a Kelvin wave in the western Pacific in January to what NOAA now calls an 83% chance of the strongest El Niño since 1950.
The NASA piece is not the only one. NOAA's Climate Prediction Center (CPC) put numbers on the event in its Oct. 8 ENSO Diagnostic Discussion, and NOAA's winter outlook, summarized by EarthSky on Oct. 16, sets out what that could mean for North America over the next few months.
A heartbeat that started in January
According to NASA, one of the first clues appeared in satellite imagery in January 2026, when a swell of warm water called a Kelvin wave was spotted near Micronesia in the western Pacific. By early April, those Kelvin waves had reached the eastern Pacific. Satellites can track the wave because it shows up in sea level: warm water expands, so the ocean surface rises where the wave carries extra heat.
"Kelvin waves are like the heartbeat of El Niño," said Josh Willis, project scientist for sea level missions at NASA's Jet Propulsion Laboratory, as quoted in the NASA feature.
Today the pattern is easy to see. NASA reports that local sea levels have risen by as much as 1 to 1.3 feet (30 to 40 centimeters) in places, while sea levels around Indonesia and northern Australia are 6 to 8 inches (15 to 20 cm) lower than normal. Water is piling up in the east and draining away in the west, which is what this kind of event looks like from orbit. At the surface, NASA says eastern Pacific sea temperatures are about 3 degrees Fahrenheit (1.7 degrees Celsius) warmer than the long-term average.
The sea-level maps use altimetry data from the Sentinel-6 satellites. NASA says scientists have tracked ocean height with satellite altimetry since 1993, and that this unbroken data record continues today with Sentinel-6. That is more than three decades of ocean height, which lets researchers compare this event with earlier ones on a consistent basis. Sea surface temperatures, by contrast, come from satellite instruments, buoys and ship sensors.
What NOAA's numbers say
The CPC numbers are more precise than the headline phrase, and they are worth reading closely.
An El Niño Advisory is in effect. CPC says a strong-to-very-strong El Niño is likely through January–March 2027, which it describes as remaining greater than an 83% chance. Sea surface temperature anomalies exceed +4.0 °C in portions of the eastern equatorial Pacific. In the standard monitoring regions, CPC lists these anomalies:
- Niño-3.4: +2.1 °C
- Niño-3: +3.0 °C
- Niño-1+2: +3.9 °C
The "since 1950" claim comes from a separate set of probabilities. CPC estimates the chance of a historic event that would exceed the strength of previous El Niño events dating back to 1950, defined as +2.5 °C or more for a 3-month RONI value, for each overlapping three-month season:
- September–November: 54%
- October–December: 83%
- November–January: 70%
Those odds peak in October–December and then fall. So the forecast is not for an event that keeps strengthening without limit. It suggests a peak that is most likely to set a record right around the turn of the season. The 83% figure also appears twice in NOAA's material with two different meanings. One is the record-strength probability for October–December. The other is the lower bound on the chance of a strong-to-very-strong event continuing into early 2027. They are separate questions that happen to share a number.
What it could mean for winter
El Niño is a Pacific phenomenon, but it affects weather well beyond the Pacific. According to EarthSky's summary, NOAA's new winter outlook calls for warmer-than-average conditions across much of northern North America, including Alaska, and wetter-than-average conditions across the southern half of the United States and up the East Coast.
The mechanism is the jet stream. EarthSky explains that El Niño helps shift the Pacific jet stream farther east and south, which can send tropical moisture into California and keep the Pacific Northwest drier and warmer than usual. For regions that have been short of water, the outlook has some good news: drought is expected to improve or even end across much of the Southwest, the South and parts of the East Coast. The same summary notes the flip side, with droughts likely to develop or worsen in the northern Rockies, parts of the northern Plains, and eastern Oregon and Washington.
Seasonal outlooks give probabilities, not promises. EarthSky stresses that the outlook says nothing about snowfall, which can only be forecast accurately within about a week of an event. CPC makes a similar point about the Pacific itself: with an event of this magnitude, the chances of El Niño-consistent impacts are larger, though not guaranteed.
Why It Matters
An El Niño strong enough to exceed every event since 1950 would be a reference point for climate science for years. A record like that only helps if the measurements behind it are consistent, and that is why the altimetry record matters. Because Sentinel-6 continues an unbroken record that began in 1993, today's sea-level bulge can be set against earlier events using the same kind of measurement.
The practical consequences could be large. A wetter southern US could ease drought in the Southwest and South, while a drier outlook for the northern Rockies, parts of the northern Plains and eastern Oregon and Washington points the other way. Across the Pacific, the lower sea levels around Indonesia and northern Australia show that the ocean's warm water has shifted east, and the weather shifts with it. NASA notes that people around the world, including farmers, firefighters and coastal communities, are already experiencing the effects in different ways.
NASA is also watching the event with other instruments. Its PACE satellite, launched in 2024, is tracking subtle changes in ocean color, and NASA says equatorial Pacific waters have become measurably bluer in recent months as weaker trade winds reduce the upwelling of nutrient-rich water and phytoplankton decline. This is the first El Niño since PACE launched. It is a different use of space-based ocean sensing from sea-level mapping: following one ocean-wide event as it builds toward what may be a historic peak.
The next few months will show whether the 83% forecast holds. NOAA's own probabilities say October through December is the most likely window for a record, and CPC's next ENSO Diagnostic Discussion is scheduled for Nov. 12, 2026, so the next update is close.